

Improved flow analytics with per step analytics
See revenue, interactions and per step performance for every flow on one page.
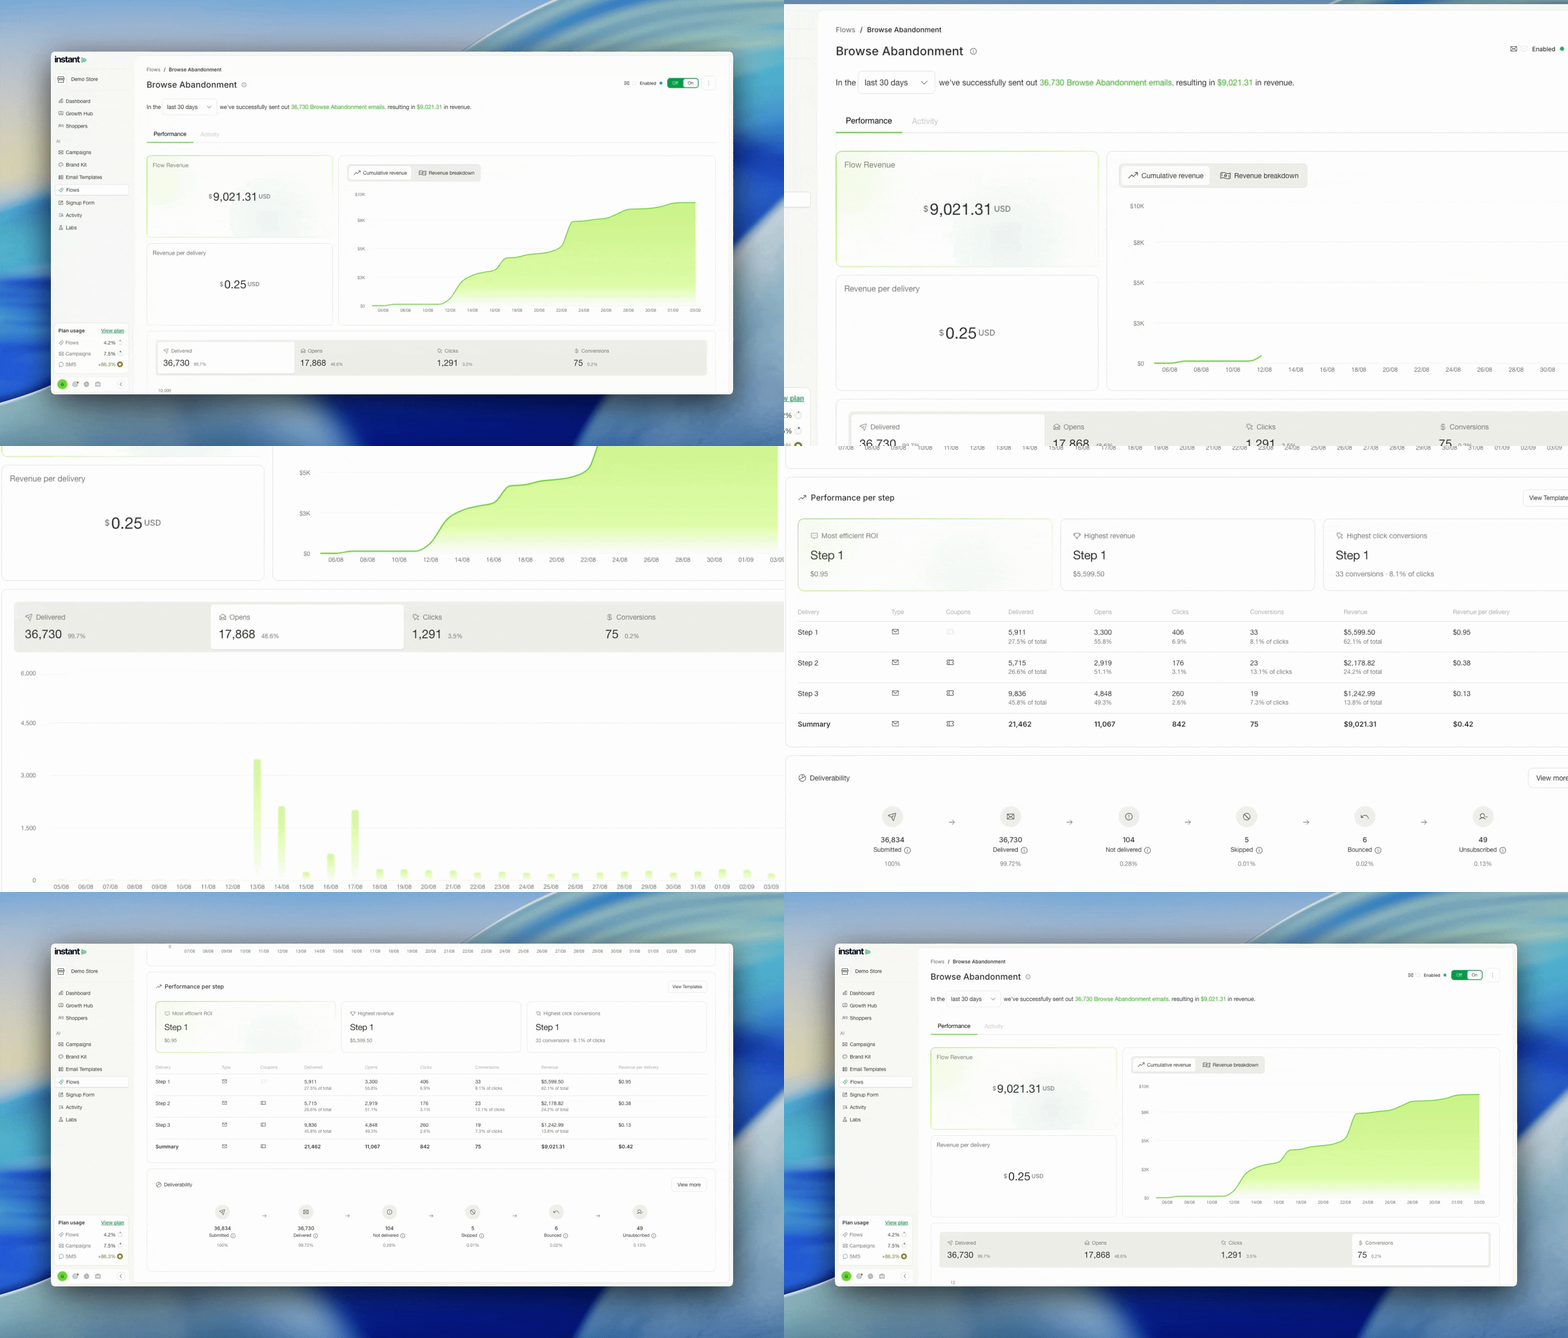
The numbers behind your flows were already being tracked. What changes here is the order they appear in, so the revenue a flow brought in reads first and the detail sits under it. The per step card is the new part. You can see which touchpoint is doing the work and what share of the results comes from each step, so a flow that looks healthy overall no longer hides a step that is not pulling its weight.
- Flow pages have a new structure, with revenue data at the top, then interactions, then the per step breakdown
- Delivered, opens, clicks and conversions each plot as a graph over time when you select their tab
- A new performance per step card breaks down performance by touchpoint, alongside the totals